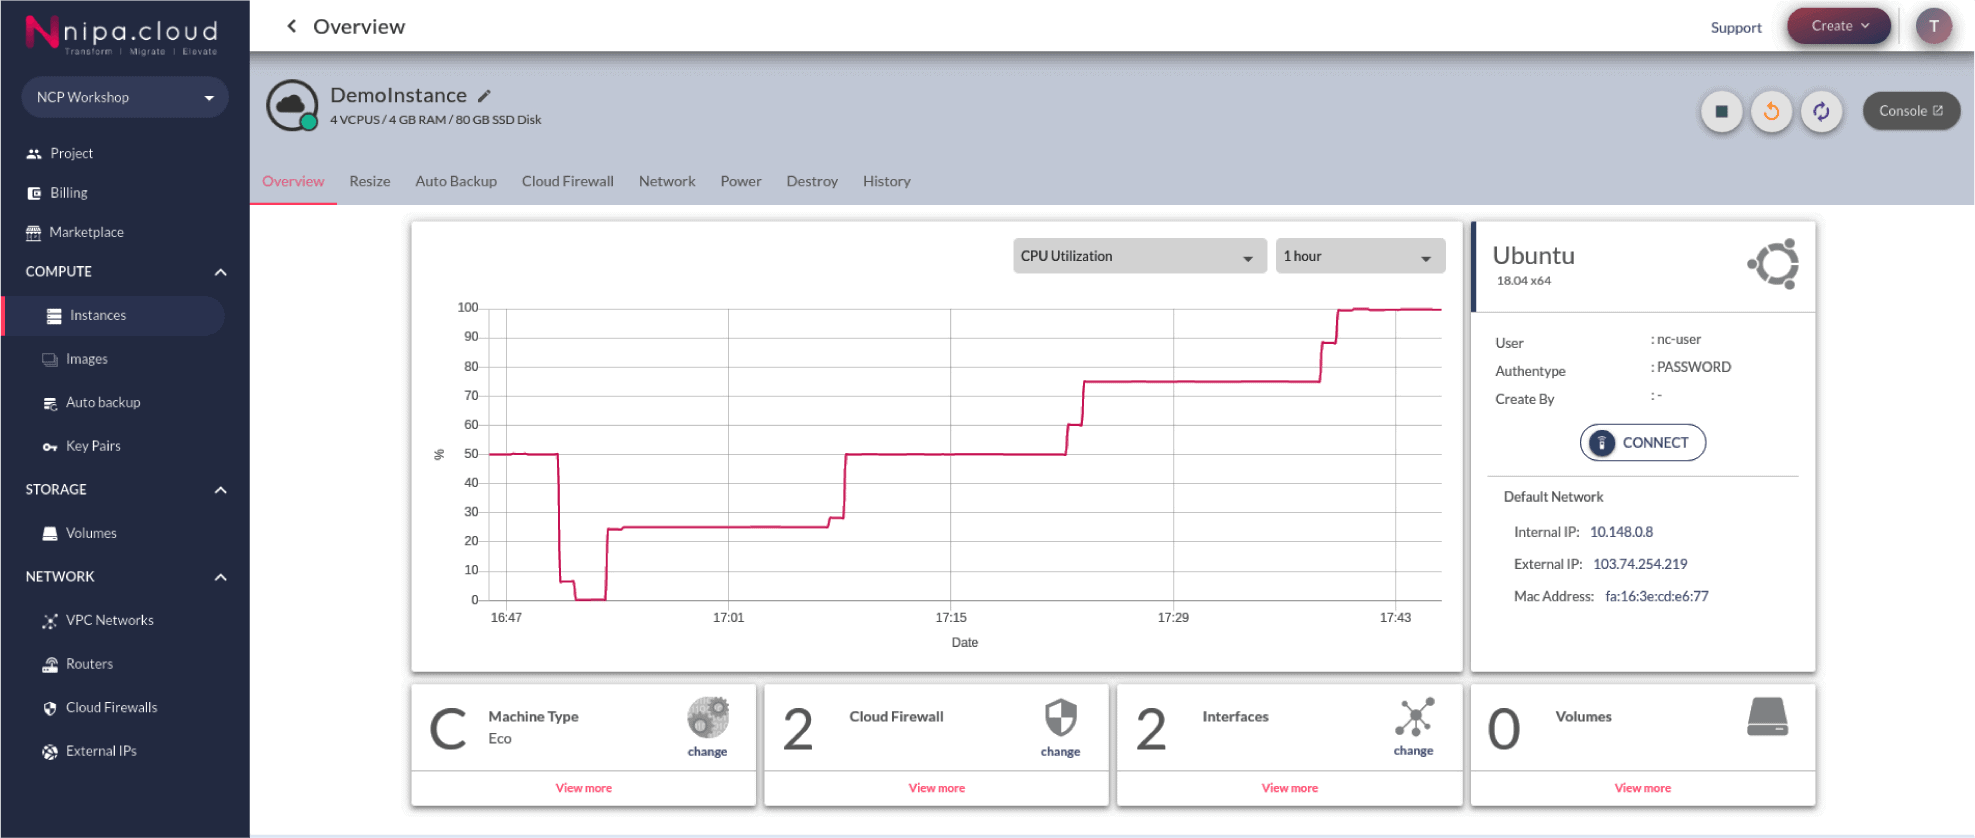
Nipa Cloud has a monitoring service system available for every instance. You can easily check the instance’s performance by login to Nipa Cloud system, select the instance menu, then select your instance and it will redirect to the overview page of the instance.
Monitoring
Nipa Cloud has a monitoring service system available for every instance. You can easily check the instance’s performance by login to Nipa Cloud system, select the instance menu, then select your instance and it will redirect to the overview page of the instance.


Instance Monitoring
An instance monitoring system will present the real-time graph, past up to 30 days. You can view CPU Utilization, Network bits, Network packets, Disk bytes and Disk operations which can choose to view backwards 1 hour, 6 hours, 24 hours and 30 days.

Status
More ever, there is also an icon to showing the status of the instance at that time

Block Information
If the instance is active, the icon will be green or grey in case of shutoff status in that time which has block information of the selected instance, which show the types of image version and operating system, user information, authentication type by, create by default network.

Default Network
Show IP detail that instance used separately by internal IP and external IP, both showing mac address.
Overview Instance

- Machine type that the instance is used will show specification Vcpus, RAM, DISK Estimated performance and network bandwidth limit
- Cloud firewall that instance uses, showing the port details in part of incoming and outgoing separate by a group from setting for easy viewing
- The interface show details of internal IP and external IP, both showing mac address
- Volumes show the volumes that were attached and instance display size and path

